Research and Training Center on Disability in Rural Communities
(RTC:Rural)

The Research and Training Center on Disability in Rural Communities (RTC:Rural) works to improve the opportunities of people with disabilities to participate in their rural communities. We conduct research, offer training and technical assistance, and share resources in the areas of health, employment, community participation, and independent living.
As leaders in rural disability research, RTC:Rural collaborates with disability community members across the country to shape our research agenda and ensure that our evidence-based solutions fit their rural contexts. Together, we work to improve the ability of people with disabilities to engage and thrive in rural life.
Get Involved with RTC:Rural - Projects Currently Recruiting CIL Staff or People with Disabilities:
We have an excellent slate of new projects, and we need your continued support to ensure our efforts represent disability voices and experiences. This support can take many forms:
- Participate with us in national meetings to shape policy and action.
- Serve on a project advisory group.
- Become a pilot site for testing a new program.
- Shape training to build CIL capacity.
- Help us share rural stories and experiences.
Here is a brief description of some of our projects and how you might become involved!
Rural Disability Community Summit
Rural disability data is often limited or difficult to access. Our Rural Disability Community Summit will bring together advocates, people with disabilities, providers, researchers, and policymakers to collectively identify data that matters to the rural disability community. Maybe you would like to participate in such a discussion? Contact Lillie Greiman (
Rural Personal Assistance Services (PAS) Workforce Capacity
There are not enough rural PAS workers to meet the growing demand. Our PAS Workforce Capacity project will identify key factors associated with PAS worker shortages and strategies to increase workforce capacity. We need dedicated advisors to make this happen. Contact Rayna Sage (
Peer-group and One-on-One Health Promotion
We are looking for CIL delivery sites who will help us evaluate two models of health promotion, one delivered via an online group, and another delivered using a remote one-on-one health coaching model. We also need partners who will help us understand how the health coaching model would best fit with how CILs deliver services. Contact Krys Standley (
Rural Transportation Vouchers
Transportation voucher programs can increase transportation access in rural areas. We are looking for stakeholder advisors including rural disability leaders and transportation experts to help us create an updated Transportation Voucher Toolkit and inform our project activities. Contact Andrew Myers (
Capacity Building in Home Usability
Past research has demonstrated the positive outcomes from providing low-cost home modifications to people with disabilities. Now we want to ensure CILs can both implement and sustain these types of programs. Help us develop and test a model for building organization capacity in supporting the Home Usability Program. Contact Lillie Greiman (
If you want a description of all the exciting projects including in our new funding, please visit the RTC:Rural Website. On the resources page you will find a host of toolkits and other resources for use by Centers for Independent Living and other service providers, advocates, or organizations serving people with disabilities. Or visit the Focus Areas section to review our research publications by topic. Can’t find what you’re looking for? Email
Additional Materials:
- Recruitment for PAS Workface Capacity PDF
- Recruitment for RISE Evaluation
- VR Flyer Digital PDF
- HCL Flyer PDF
- FGT Flyer PDF
- RTC Funded Flyer
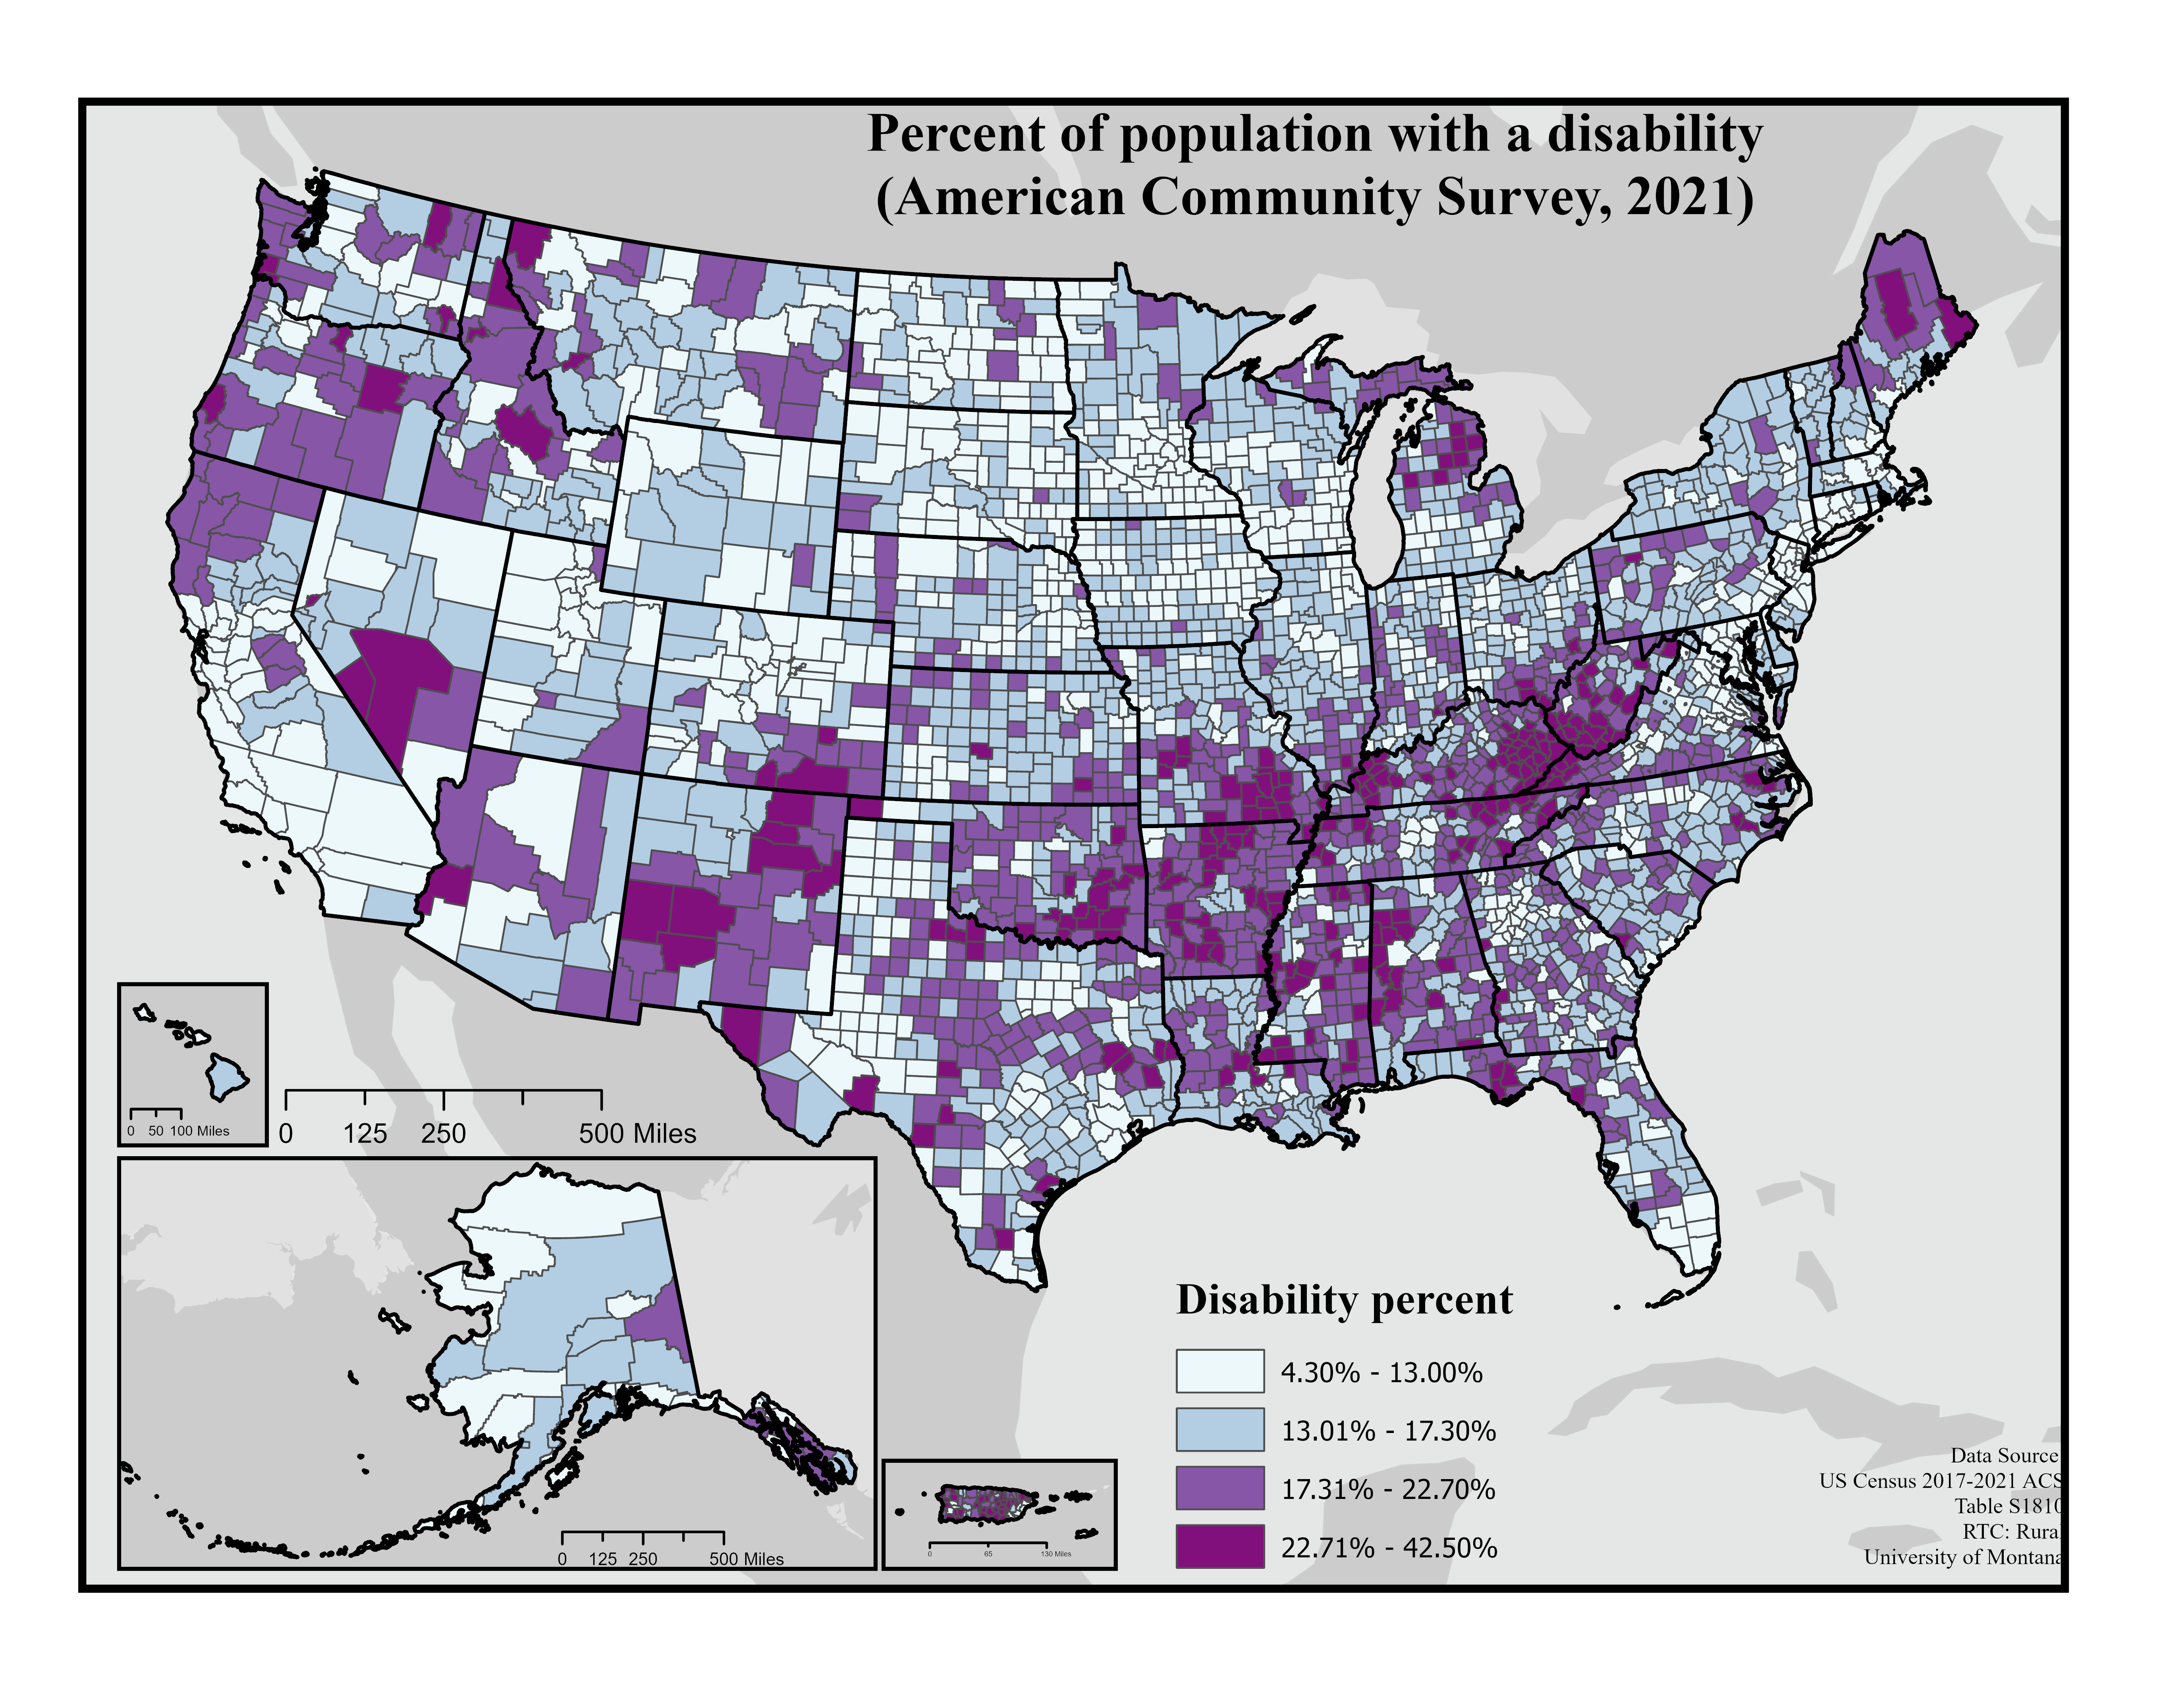
Percent of population with a disability, 2021

A map of United States counties showing the percentage of people with disabilities in each county in 4 shades of light to dark purple. Counties with percentages of 4.3% to 13% are shaded the lightest, then slightly darker are counties with rates from 13.01% to 17.3%, then slightly darker are counties with rates of 17.31% to 22.7%, the darkest shade of purple is for counties with the highest rates, 22.71% TO 42.5%. Counties with the highest rates of disability are found throughout the country with concentrations in Puerto Rico, Appalachia, Arkansas, Oklahoma, New Mexico, Oregon, Northern Idaho, Northern Maine and northern Michigan.
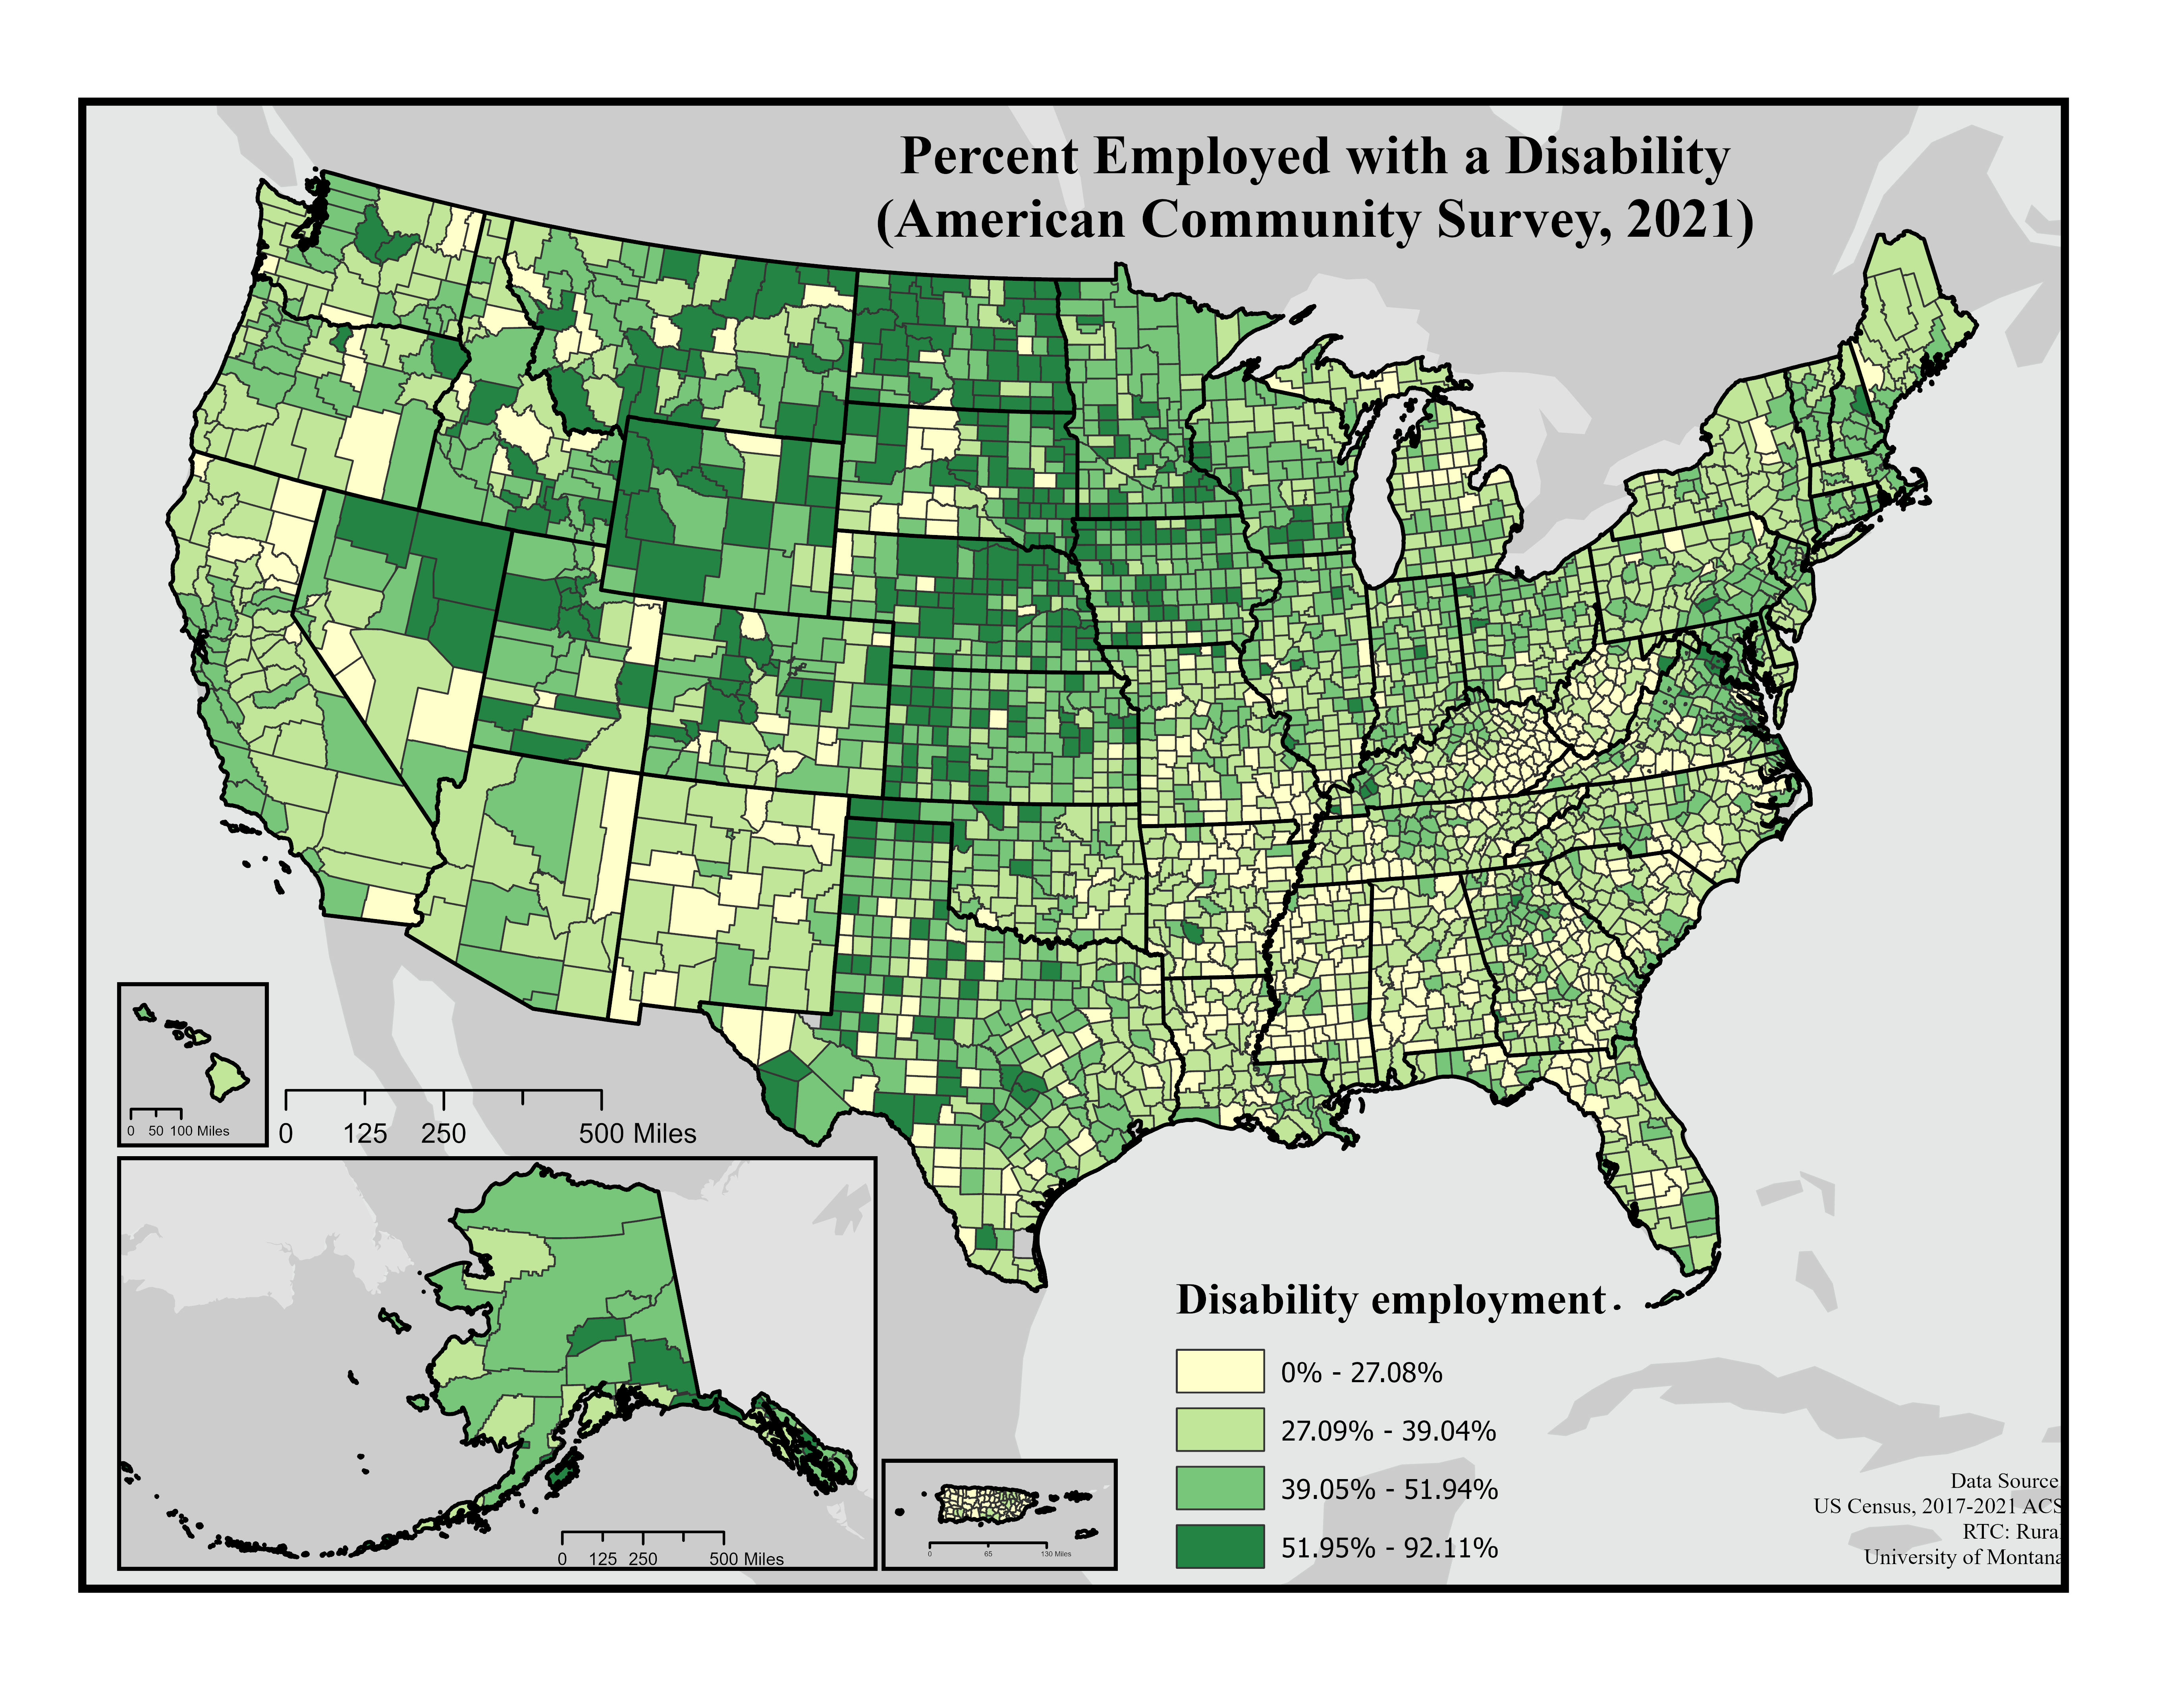
Percent Employed with a Disability, 2021

A map of the United States counties showing the percentage of people with disabilities who are employed in each county in four shades of light yellow to dark green. Counties with percentages of 0% to 27.08% are light yellow, then in light green are counties with percentages of 27.09% to 39.04%, then in darker green percentages of 39.05%-51.94% and in darkest green counties with percentages from 51.95% to 92.11%. Counties with the highest percentages of employed people with disabilities are found throughout the Great Plains states, across the Rocky Mountain West and throughout Alaska.
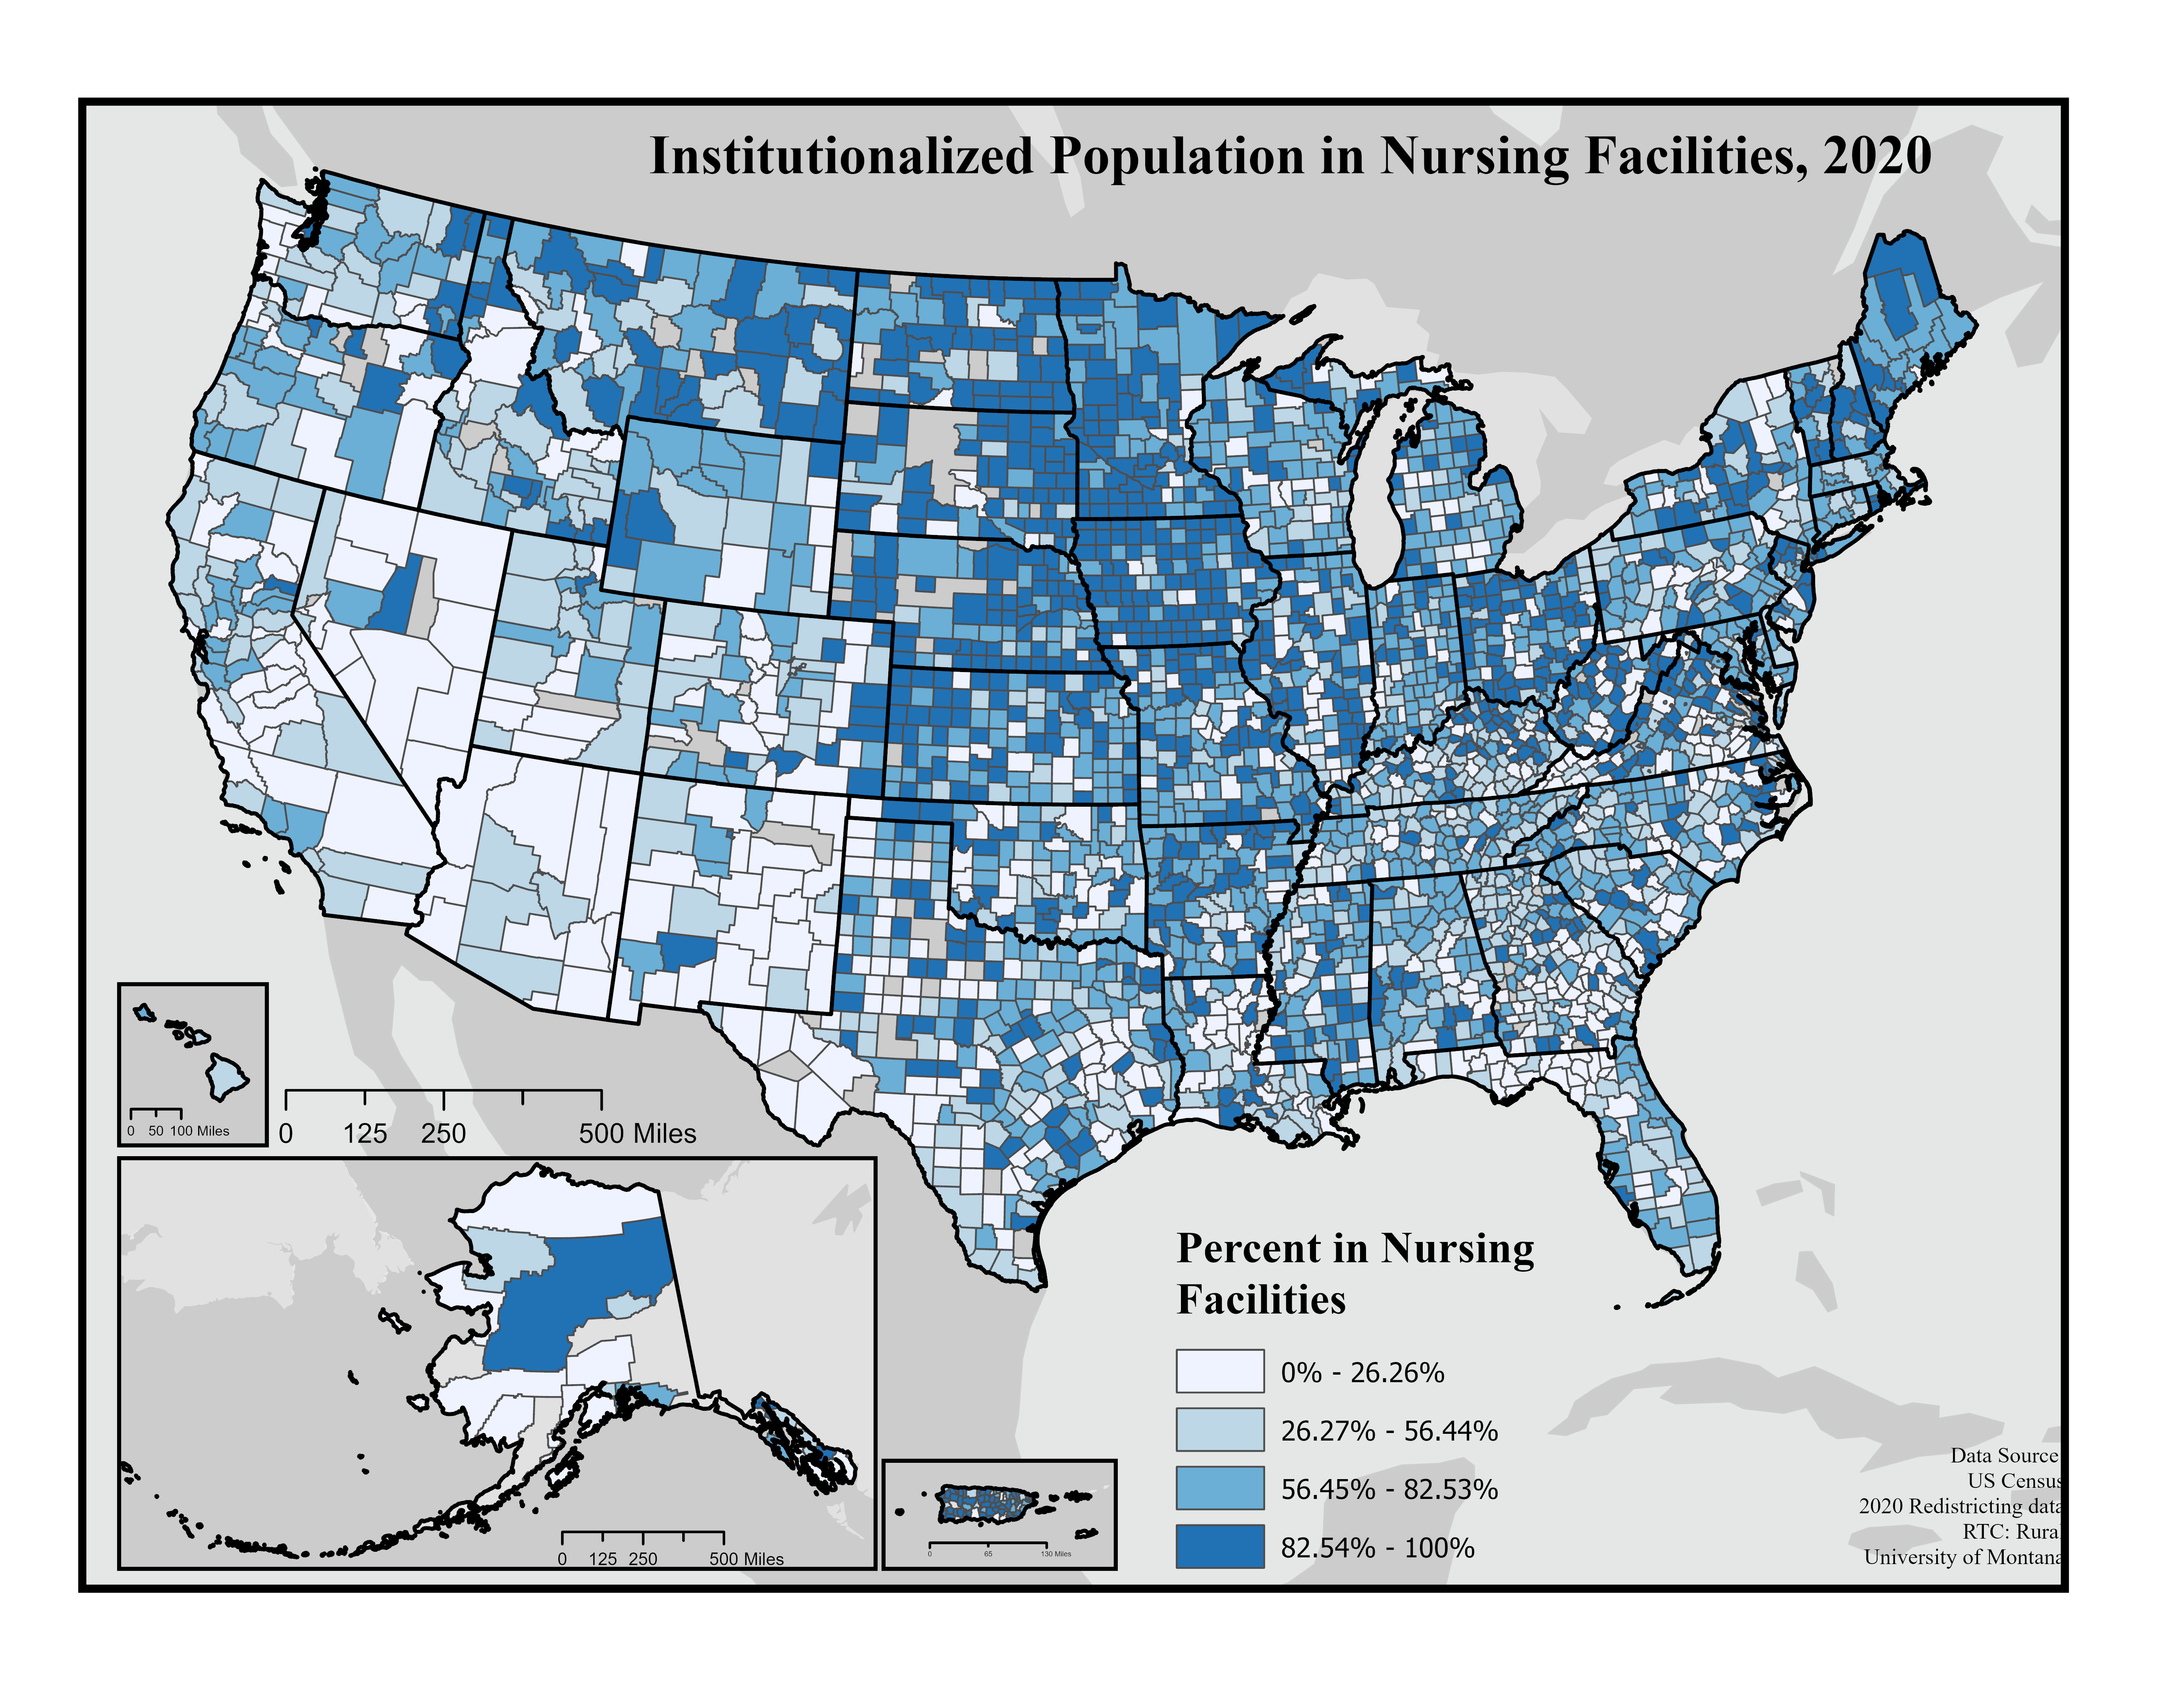
Institutionalized Populations in Nursing Facilities, 2020

A map of the United States counties showing the percentage of the institutionalized population who reside in nursing facilities in shades of light to dark blue. These data are from the US Census 2020 redistricting data. In the lightest shade of blue are counties with 0% to 26% of the institutionalized population in nursing homes. In light blue are counties with 26.27% to 56.44% and then darker blue representing 56.45% to 82.53%. The darkest blue counties have 82.54% to 100% of the institutionalized populations residing in nursing homes. Counties with the highest proportion of institutionalized populations in nursing homes are scattered across the country with some clustering in the Great Plains, and rural counties in the Midwest, West, Northeast and South.
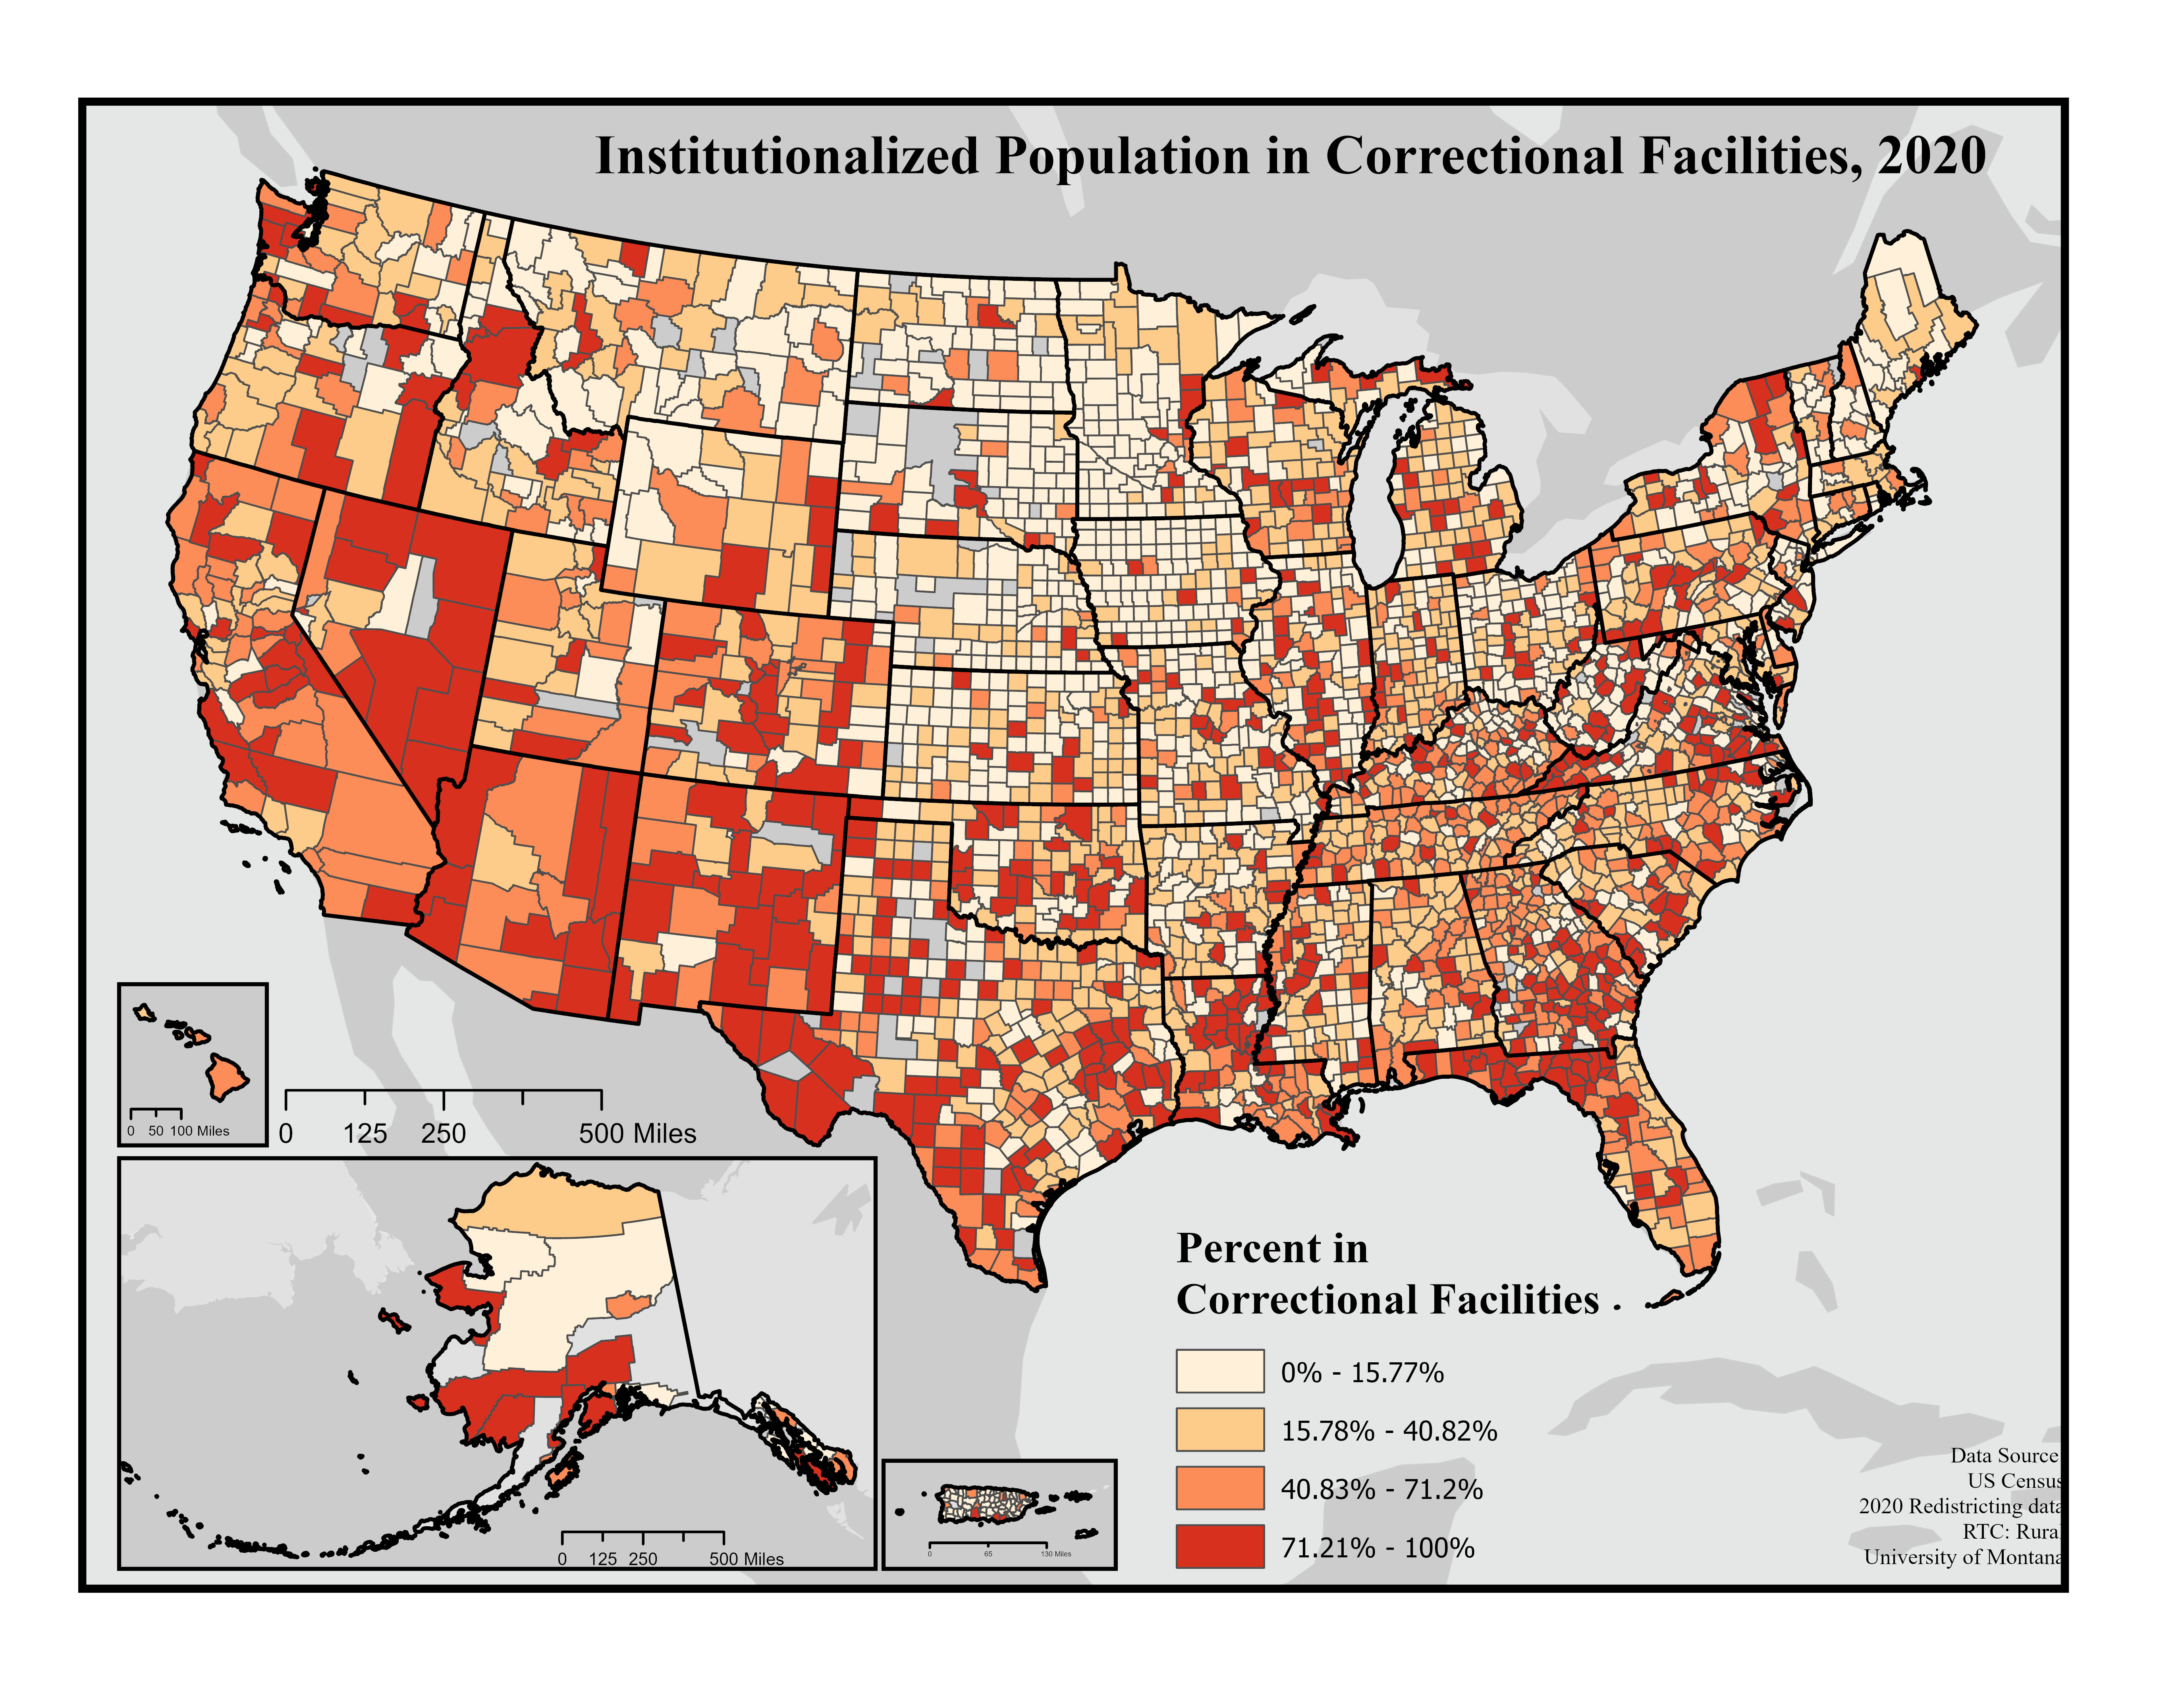
Institutionalized Populations in Correctional Facilities, 2020

A map of United States counties showing the percentage of the institutionalized population who reside in correctional facilities (i.e. prisons and jails) in shades of light to dark orange. These data are from the US Census 2020 redistricting data. In the lightest orange are counties with 0% to 15.77% of the institutionalized population in correctional facilities. In light orange are counties with 15.78% to 40.82% in correctional facilities, in darker orange are counties with 40.83% to 71.2%. The darkest orange are counties with 71.21% to 100% residing in prisons or jails. Counties with the highest proportion of institutionalized populations in correctional facilities are scattered across the country with some clustering in the Southwest (including California) and the Florida panhandle.
Return to Vendor Booths